
Checked against Bank of India’s Q2 FY27 results (23 October 2026) and RBI directions as of 14 November 2026. Educational content, not investment advice.
Quick answer: An NPA (non-performing asset) is a loan whose borrower has stopped paying for long enough, usually 90 days, that the bank must treat it as bad. The bank then sets money aside, called a provision, and that charge reduces profit. Three numbers tell most of the story: the gross NPA ratio (how much of the loan book is bad), the net NPA ratio (how much is still unprotected) and the provision coverage ratio, or PCR (how much of the bad loans is already covered).
If you have just joined a bank, or you have just started reading bank results as an investor, “NPA” is the first word that will confuse you. Every quarter the headlines say something like “gross NPA improved to 1.6%”. But what exactly is being measured? Who decides when a loan is bad? And why can two banks with the same NPA ratio carry very different risks?
This guide starts from zero and builds up. We cover the RBI rules, the provisioning ladder, the ratios, and the way bad loans flow through the profit and loss account. Then we work through a real example, Bank of India’s Q2 FY27 result, so you can see the arithmetic behind a headline. We finish with a checklist for analysing any bank stock.
In this article
- What is an NPA?
- The warning stages before a loan turns bad
- Sub-standard, doubtful and loss assets
- Provisions: how banks set money aside
- The NPA ratios you must know
- How bad loans hit profit and capital
- Worked example: Bank of India, Q2 FY27
- How to analyse a bank stock using NPA data
- Mistakes beginners make
- What changes from April 2027
- Key takeaways and FAQs
1. What is an NPA?
Imagine you lend ₹10,000 to a friend who promises to repay in monthly instalments. After three months of silence, you stop counting that money as safe. A bank thinks the same way, with one difference: the money it lent mostly belongs to depositors. If borrowers stop paying, the bank still owes depositors their money and interest. So the RBI draws a clear line. Once a loan crosses it, the loan is “non-performing”.
The line is deliberately mechanical. RBI classification depends on the record of repayment, not on the borrower’s wealth or the value of collateral. A borrower with a big house and a missed instalment is still an NPA candidate.
| Type of credit | When it becomes an NPA |
|---|---|
| Term loan | Interest or an instalment is overdue for more than 90 days |
| Bills purchased or discounted | The bill is overdue for more than 90 days |
| Cash credit or overdraft | The account is “out of order”: the balance stays above the limit or drawing power for 90 days, or there are no credits for 90 days, or credits do not cover the interest charged in the previous 90 days |
| Agricultural crop loans | Dues stay overdue for two crop seasons (short-duration crops) or one crop season (long-duration crops). Other agricultural loans follow the 90-day rule |
Source: RBI (Commercial Banks – Income Recognition, Asset Classification and Provisioning) Directions, 2025, updated 1 July 2026.
Two more rules matter. First, classification is borrower-wise. If one loan to a borrower turns bad, every loan the bank has given that borrower is classified bad too. This stops a bank from lending fresh money so the borrower can repay an old loan, a practice called evergreening. Second, the tagging is done by the bank’s system at the end of each day. A payment that arrives after the day-end cut-off is a late payment, whatever the date on the calendar says.
2. The warning stages before a loan turns bad
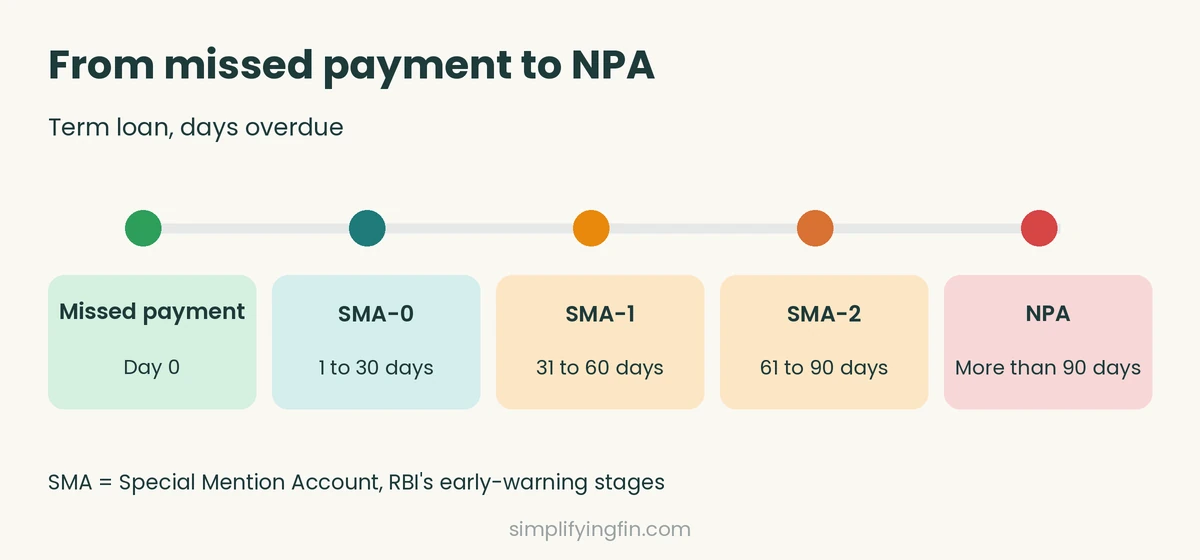
Banks do not wait for day 91. RBI requires them to flag early stress through Special Mention Accounts, or SMA.
| Stage | Term loans: overdue for | Cash credit or overdraft: balance above limit for |
|---|---|---|
| SMA-0 | Up to 30 days | Not used |
| SMA-1 | 31 to 60 days | 31 to 60 days |
| SMA-2 | 61 to 90 days | 61 to 90 days |
Source: RBI (Commercial Banks – Resolution of Stressed Assets) Directions, 2025.
Banks also report borrowers with total exposure of ₹5 crore and above to a central database called CRILC, so one lender can see when a borrower is slipping at another. For investors the lesson is simple: SMA-2 accounts are tomorrow’s NPAs. A falling SMA-2 pool is a good sign. A rising one is an early warning that headline NPA numbers have not caught up yet.
3. Sub-standard, doubtful and loss assets
After a loan becomes an NPA it slides down three categories as time passes without recovery.
- Sub-standard: an NPA for up to 12 months. The bank is likely to lose something unless the problem is fixed.
- Doubtful: an asset that has stayed sub-standard for 12 months. Full recovery is now highly questionable. Banks track it by age: up to one year, one to three years, and more than three years in the doubtful category.
- Loss: a loss has been identified by the bank, its auditors or an RBI inspection, but the amount has not been fully written off. It is treated as virtually uncollectable.
The clock can also be skipped. If the realisable value of the security falls below 50% of its value at the last valuation, the asset is classified doubtful straight away. If the security is worth less than 10% of the outstanding amount, it is ignored and the asset becomes a loss asset.
4. Provisions: how banks set money aside
A provision is an amount a bank deducts from its profit and parks as a reserve against expected losses. It is an accounting entry, not cash leaving the bank, but it reduces reported profit immediately and, over time, the bank’s capital.
There are two kinds. General provisions are held against loans that are still performing, because some of them will eventually go bad. Specific provisions are held against loans already classified as NPAs. Specific provisions are the ones subtracted from gross NPA to get net NPA.
| Asset | Provision required |
|---|---|
| Standard: farm credit, individual housing, small and micro enterprises | 0.25% |
| Standard: most other loans, including medium enterprises | 0.40% |
| Standard: commercial real estate | 1.00% (0.75% for residential-housing projects) |
| Sub-standard | 15% of the outstanding; 25% if the exposure is unsecured; 20% for certain infrastructure loans |
| Doubtful: unsecured portion | 100% |
| Doubtful: secured portion | 25% in the first year, 40% for one to three years, 100% after three years |
| Loss | 100% |
Source: RBI IRAC Directions, 2025. These are the norms in force until 31 March 2027.
A worked example of the ladder
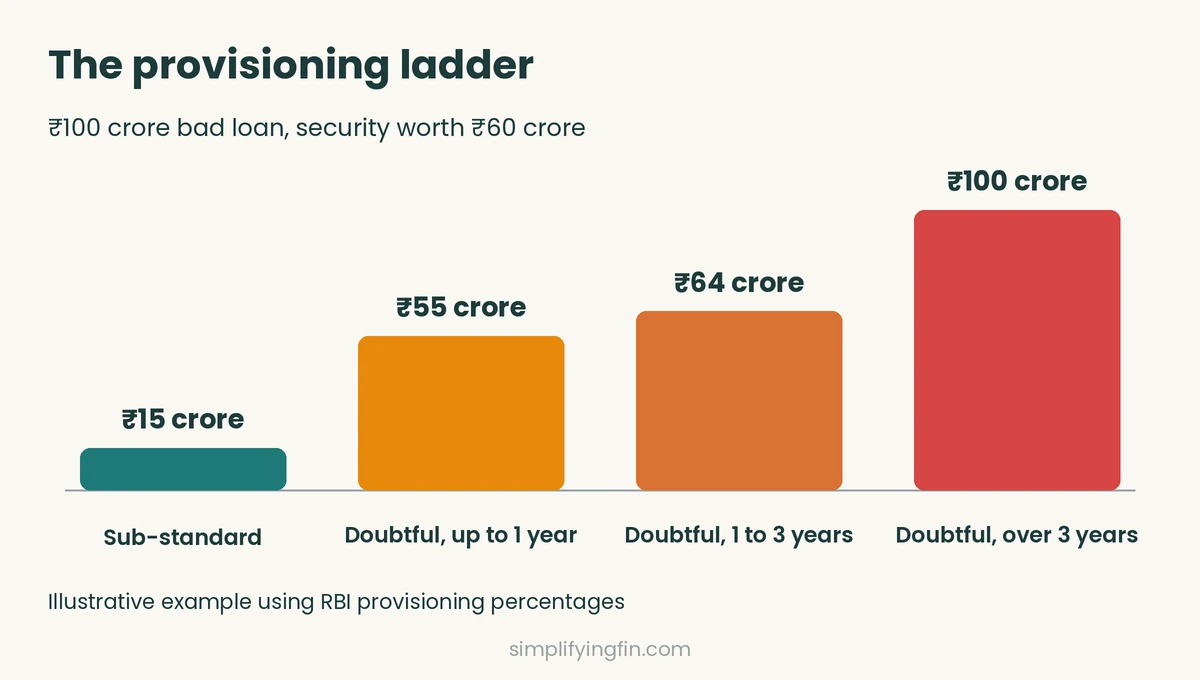
Take a ₹100 crore loan that turns bad. The realisable value of its security is ₹60 crore, so ₹40 crore is unsecured. We keep the security value constant to keep the sums simple.
| Stage | Provision calculation | Total provision |
|---|---|---|
| Sub-standard | 15% × ₹100 crore | ₹15 crore |
| Doubtful, up to 1 year | 100% × ₹40 crore + 25% × ₹60 crore | ₹55 crore |
| Doubtful, 1 to 3 years | 100% × ₹40 crore + 40% × ₹60 crore | ₹64 crore |
| Doubtful, over 3 years | 100% × ₹40 crore + 100% × ₹60 crore | ₹100 crore |
Our arithmetic using the RBI percentages above.
Notice how the cost climbs. The bank sets aside ₹15 crore in the first year but ₹100 crore by year four. That is why a bank that leaves a bad loan unresolved pays for it repeatedly, and why quick recovery is worth so much.
5. The NPA ratios you must know
Raw NPA amounts mean little without context. A ₹13,000 crore NPA is small for a large bank and huge for a small one. So analysts use ratios.
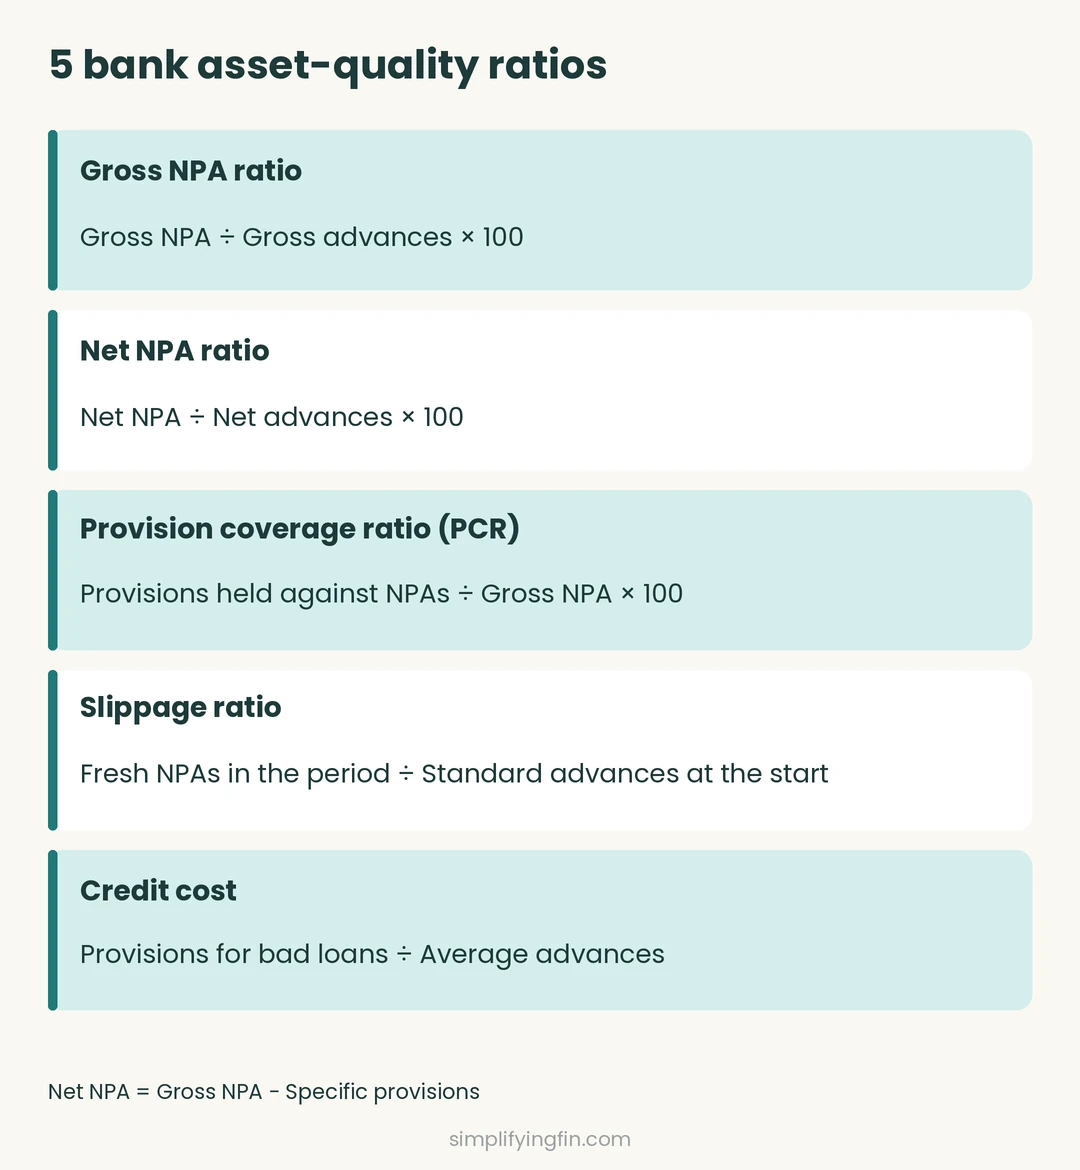
Gross NPA ratio = Gross NPA ÷ Gross advances × 100
It shows what share of all lending has gone bad. Gross NPA is the total of sub-standard, doubtful and loss assets.
Net NPA = Gross NPA − Specific provisions held (plus certain other deductions such as claims received from credit guarantee agencies)
Net NPA ratio = Net NPA ÷ Net advances × 100, where net advances are gross advances less those provisions.
Provision coverage ratio (PCR) = Provisions held against NPAs ÷ Gross NPA × 100
It shows how much of the bad-loan pile is already paid for. RBI sets no minimum PCR; each bank decides its own cushion.
Slippage ratio = Fresh NPAs added in a period ÷ Standard advances at the start shows how fast new bad loans appear. Banks differ on whether they annualise it, so read the definition.
Credit cost = Provisions for bad loans ÷ Average advances shows the yearly price of bad loans as a share of lending. Definitions again vary slightly.
An example with made-up numbers
Example Bank has gross advances of ₹1,000 crore, gross NPA of ₹40 crore and specific provisions of ₹28 crore.
| Measure | Calculation | Result |
|---|---|---|
| Gross NPA ratio | 40 ÷ 1,000 | 4.00% |
| Net NPA | 40 − 28 | ₹12 crore |
| Net advances | 1,000 − 28 | ₹972 crore |
| Net NPA ratio | 12 ÷ 972 | 1.23% |
| PCR | 28 ÷ 40 | 70% |
Hypothetical numbers for learning only.
The technical write-off twist
A technical write-off removes a bad loan from the bank’s books for accounting purposes while the loan stays outstanding in the borrower’s account. The bank does not waive its claim and can keep trying to recover. It cleans up the reported NPA, which is why two PCR figures exist: one that counts only loans still on the books, and a higher one that adds written-off accounts back. When you compare banks, compare like with like. Ask whether a quoted PCR includes technically written-off accounts.
6. How bad loans hit profit and capital
Bad loans hurt a bank through three channels.
1. Lost interest income. When a loan becomes an NPA, the bank stops recognising interest on an accrual basis. Interest that was booked earlier but never collected is reversed. Meanwhile the bank keeps paying depositors, so the margin on that loan turns negative.
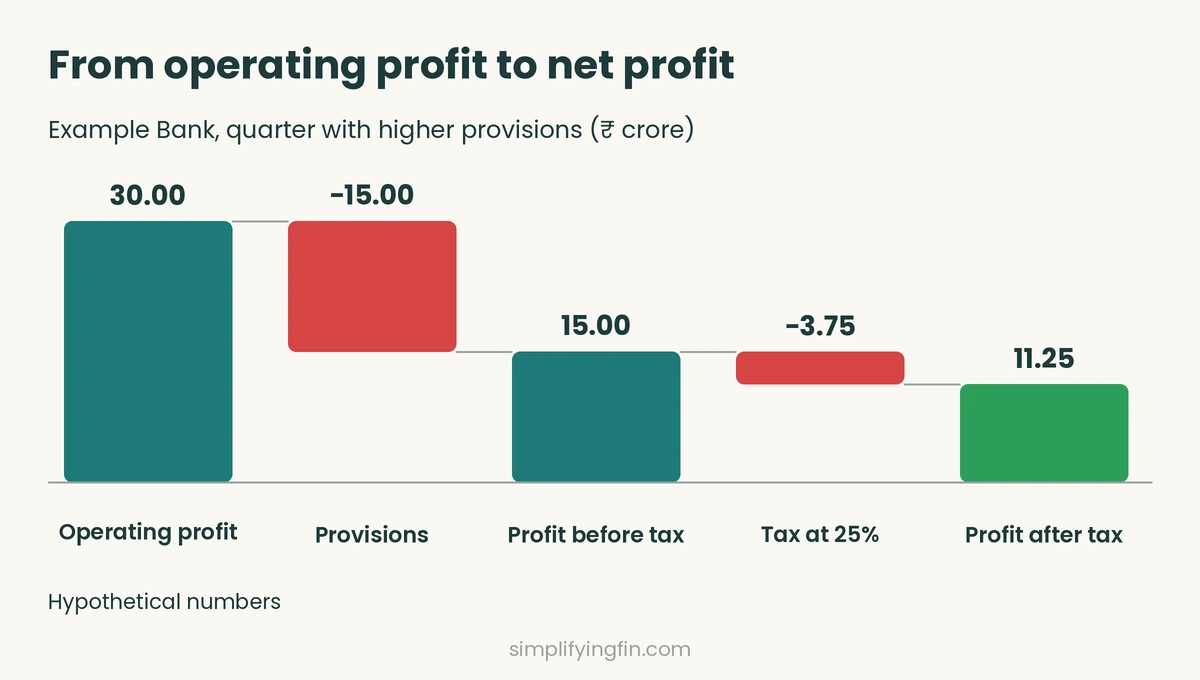
2. Provisions. The provision charge sits below operating profit in the profit and loss account. Operating profit is what the bank earns before bad-loan costs and tax. Subtract provisions and you get profit before tax.
3. Capital. Provisions reduce retained earnings, which are part of the bank’s core capital. NPAs also carry heavier risk weights in capital calculations: the unsecured portion of an NPA, net of provisions, is risk-weighted at 150%, 100% or 50%, depending on how much has been provided. And if a bank’s net NPA ratio reaches 6%, it can fall under RBI’s Prompt Corrective Action framework, which restricts dividends, branch expansion and other activities.
What a provision does to profit
Suppose Example Bank earns an operating profit of ₹30 crore in a quarter. We assume a tax rate of 25% to keep things simple.
| Item (₹ crore) | Normal quarter | Higher provisions |
|---|---|---|
| Operating profit | 30.00 | 30.00 |
| Provisions for bad loans | 10.00 | 15.00 |
| Profit before tax | 20.00 | 15.00 |
| Tax at 25% | 5.00 | 3.75 |
| Profit after tax | 15.00 | 11.25 |
Hypothetical numbers. Our arithmetic.
A ₹5 crore rise in provisions, a rise of 50%, cut profit after tax by 25%. This is why bank profit can swing sharply from quarter to quarter even when the lending business is steady. It also works in reverse. When a bank recovers money from loans it had already written off, or reverses a provision that is no longer needed, profit jumps without any improvement in day-to-day banking. Smart analysts separate the two.
7. Worked example: Bank of India, Q2 FY27
Time to apply all this to a real result. Bank of India reported its Q2 FY27 (July to September 2026) numbers on 23 October 2026. We use the standalone figures, in ₹ crore, from the bank’s results as reported by the media and the bank’s presentation, and flag our own arithmetic. For the full story of the quarter, read our Bank of India Q2 FY27 results walk-through.
| Item | 30 Sep 2026 | 30 Jun 2026 | 30 Sep 2025 |
|---|---|---|---|
| Gross advances | 8,55,071 | 7,97,775 | n/a |
| Gross NPA | 13,648 | 14,454 | 18,014 |
| Net NPA | 3,557 | 4,019 | 4,530 |
| Gross NPA ratio (reported) | 1.60% | 1.81% | 2.54% |
| Net NPA ratio (reported) | 0.42% | 0.51% | 0.65% |
Sources: Bank of India Q2 FY27 and Q1 FY27 results as reported by Free Press Journal, Angel One and SimplifyingFin. Net NPA for September 2025 is from the JM Financial results table.
Step 1: Gross NPA ratio
13,648 ÷ 8,55,071 × 100 = 1.5961%, which rounds to the reported 1.60%.
Step 2: Provisions held against the NPAs
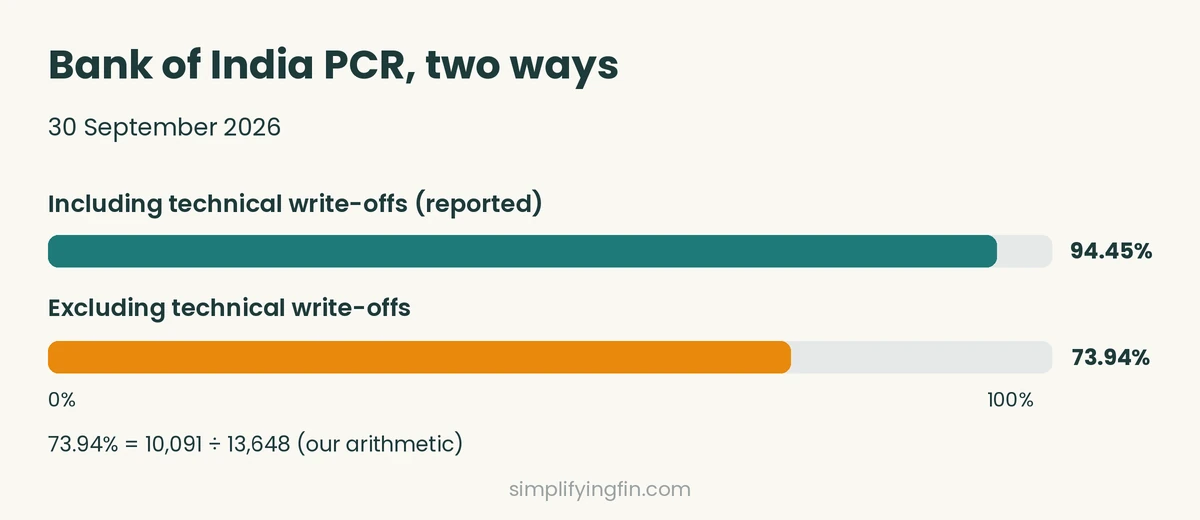
Net NPA = Gross NPA − Provisions, so Provisions = 13,648 − 3,557 = ₹10,091 crore (our derivation). This slightly overstates pure specific provisions if the bank also nets off other items, such as guarantee claims.
Step 3: Net NPA ratio
Net advances = 8,55,071 − 10,091 = 8,44,980. Net NPA ratio = 3,557 ÷ 8,44,980 × 100 = 0.4210%, matching the reported 0.42%. Using gross advances instead would give 0.416%, a small difference but the wrong method.
Step 4: Provision coverage ratio, two ways
The bank reports a PCR of 94.45%, and its results note says this includes technically written-off accounts. Without them, the coverage is 10,091 ÷ 13,648 × 100 = 73.94% (our arithmetic). On the earnings call, management referred to a tangible PCR of around 73%. Both figures are right; they answer different questions. The first shows total historical coverage. The second shows how much of today’s visible bad loans is covered.
Step 5: How the NPA stock moved during the quarter
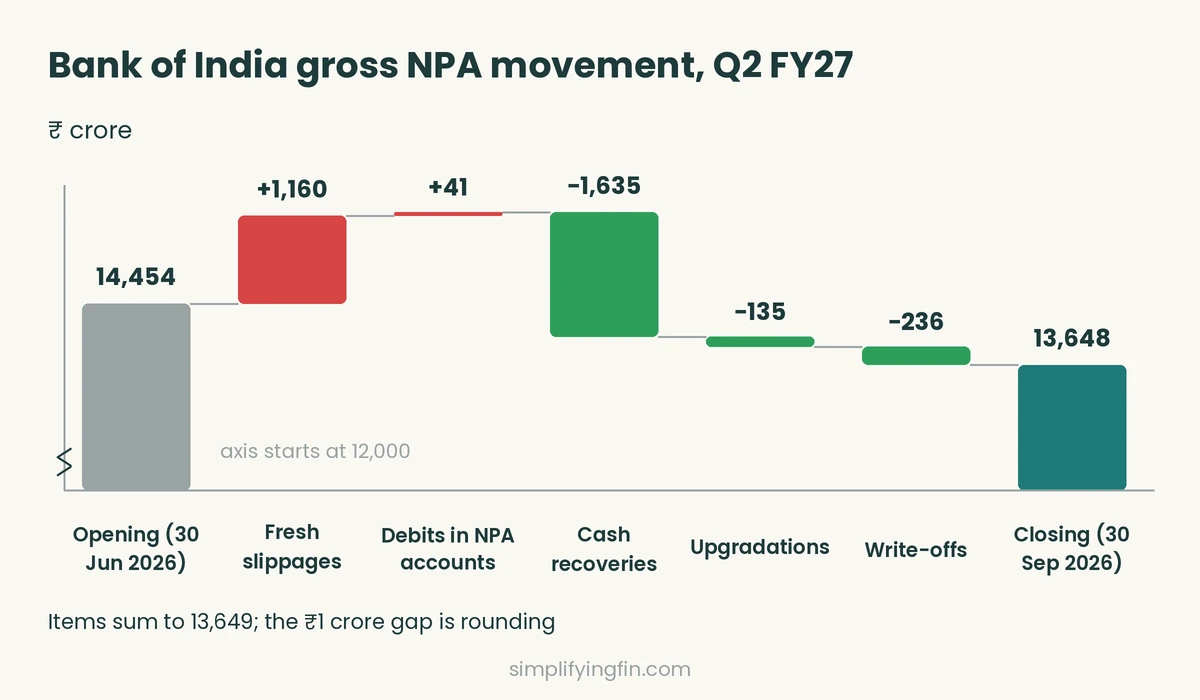
| Movement (₹ crore) | Amount |
|---|---|
| Opening gross NPA (30 June 2026) | 14,454 |
| Add: fresh slippages | 1,160 |
| Add: debits in existing NPA accounts | 41 |
| Less: cash recoveries | 1,635 |
| Less: upgradations (back to standard) | 135 |
| Less: write-offs | 236 |
| Closing gross NPA (30 September 2026) | 13,648 |
Source: Bank of India Q2 FY27 presentation as summarised by SimplifyingFin. The items sum to 13,649; the ₹1 crore gap is rounding.
The stock fell by ₹806 crore. Recoveries plus upgradations (₹1,770 crore) were about 1.5 times the new slippages. Write-offs, which clean the book without recovering cash, explain about 29% of the fall. The bank’s slippage ratio for the quarter was 0.15%, and its credit cost 0.12%.
Step 6: Why did the ratio fall? Numerator and denominator
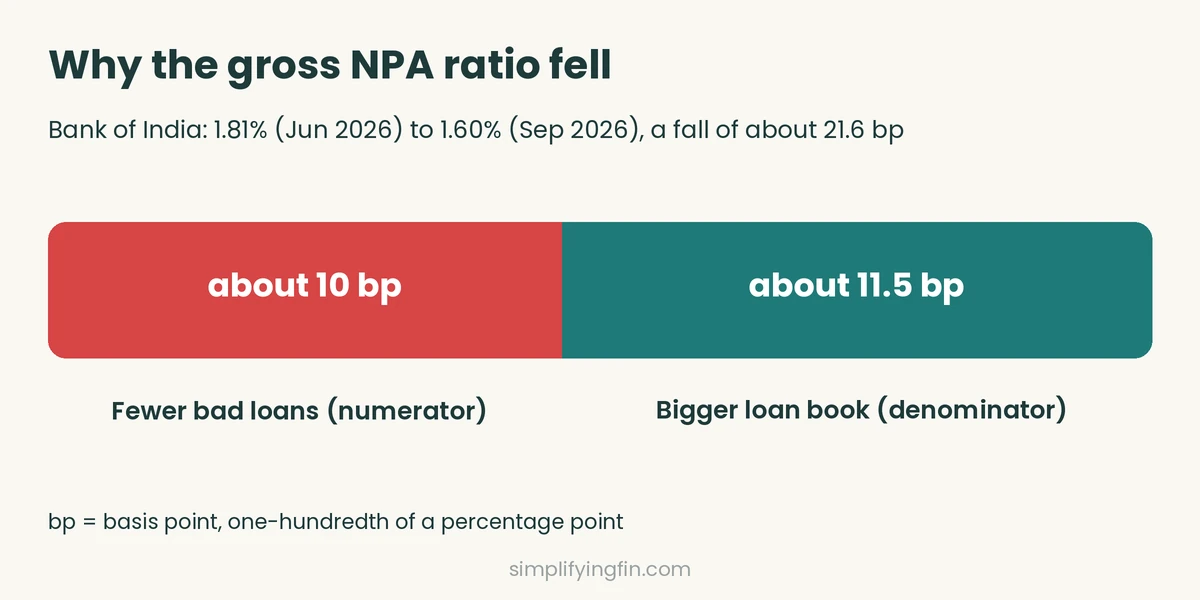
The gross NPA ratio dropped from 1.81% to 1.60%, about 21.6 basis points. Two things moved it.
- The numerator (bad loans) fell. Holding advances at the June level, the ratio would have been 1.71%, so lower NPAs account for about 10 basis points.
- The denominator (total loans) grew 7.18% in one quarter, from ₹7,97,775 crore to ₹8,55,071 crore. That accounts for the other 11.5 basis points.
Part of that growth came from a special RBI FCNR scheme. The bank says its reported business growth of 7.80% quarter on quarter would have been 5.44% without it. By our arithmetic that scheme added about ₹41,400 crore of business, counting deposits and advances together. Even if all of it were advances, the GNPA ratio would be about 1.68%, not 1.60%. So the scheme flatters the ratio slightly, but most of the improvement is real: the ratio is 94 basis points lower than a year ago.
The lesson for investors: always check whether a falling NPA ratio comes from fewer bad loans or just from a bigger loan book.
Step 7: The profit lens
| Item (₹ crore) | Q2 FY27 | Q2 FY26 |
|---|---|---|
| Operating profit | 5,089 | 3,821 |
| Net profit | 3,202 | 2,555 |
| Recoveries from written-off accounts | 978 | 337 |
| NPA provisions | about 1,010 | roughly half (management said provisions “doubled”) |
| Standard-asset and other provisions | net release of 212 | n/a |
Sources: Free Press Journal; Investywise; earnings-call summary by Cofacto; SimplifyingFin. NPA provisions are quoted as “over ₹1,000 crore” on the call.
Operating profit rose 33.2% and net profit 25.3%. Now strip out recoveries from written-off accounts. Operating profit would be ₹4,111 crore against ₹3,484 crore, growth of 18.0% (our arithmetic). Recoveries are genuine income, but they depend on a few large accounts and can be lumpy, so analysts usually look at profit both with and without them. The difference between operating profit and net profit, ₹1,887 crore, covers provisions, tax and other items.
What this example teaches: gross NPA and net NPA are low and falling; coverage is high; recoveries are beating slippages; and a meaningful part of profit growth comes from recoveries and a release of standard-asset provisions. A careful analyst celebrates the first part and keeps watching the second.
8. How to analyse a bank stock using NPA data
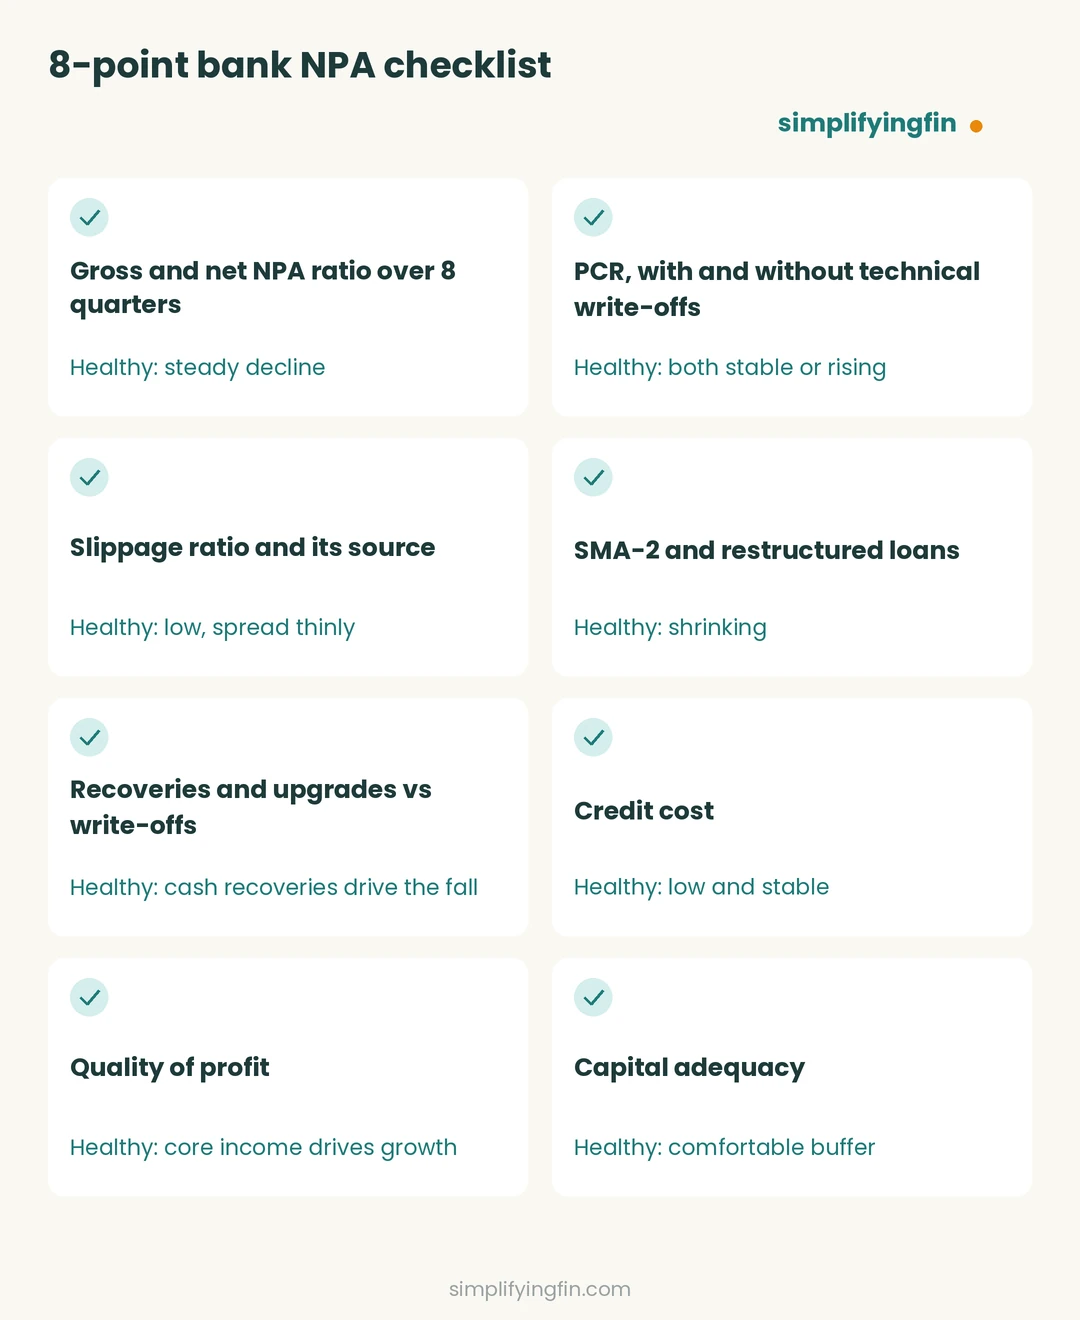
Use this checklist on any bank. The data sits in the investor presentation (look for “movement of NPAs”) and the notes to the quarterly results.
| What to check | Healthy sign | Warning sign |
|---|---|---|
| Gross and net NPA ratio over 8 quarters | Steady decline | Flat or rising |
| PCR, with and without technical write-offs | Both stable or rising | Falling, or only the flattering one is quoted |
| Slippage ratio and where it comes from | Low, spread thinly | Spikes in one segment, such as unsecured retail |
| SMA-2 and restructured loans | Shrinking | Growing faster than advances |
| Recoveries and upgrades versus write-offs | Cash recoveries drive the fall | Write-offs drive the fall |
| Credit cost | Low and stable | Rising |
| Quality of profit | Core income drives growth | One-offs drive growth |
| Capital adequacy | Comfortable buffer | Thin, or falling as loans grow |
- Read the trend, not one quarter. NPA numbers are lumpy, so judge the direction over eight quarters.
- Check what moved the ratio. Use the numerator-and-denominator test from Step 6.
- Look at the roll-forward. If write-offs are doing the work, the improvement is cosmetic; the loss still happened.
- Separate core profit from one-offs. Recoveries from written-off accounts, provision reversals and treasury gains can lift one quarter.
- Match valuation to quality. Banks are usually valued on price-to-book alongside return on assets, because NPAs hit book value. Our guides on P/E vs P/B and ROE vs ROCE explain how.
- Compare with peers. For the same quarter, Union Bank of India reported a gross NPA ratio of 2.42% and Bank of Baroda 1.78%. A ratio means more next to its peers.
9. Mistakes beginners make
- Reading only the headline ratio. Gross NPA of 1.6% sounds perfect, but what is the PCR, and where are the slippages coming from?
- Treating a low net NPA as proof of safety. It can be low because of high provisions, which is good, or because loans were written off, which is neutral.
- Ignoring the denominator. Fast loan growth lowers the ratio mechanically. If growth slows, the ratio can rise even when bad loans do not.
- Confusing recoveries. Recoveries in NPA accounts reduce NPAs. Recoveries from written-off accounts do not touch NPAs at all; they appear as income.
- Forgetting the lag. Early stress appears in SMA data first, then slippages, then provisions, then profit.
10. What changes from April 2027
Today’s rules are an incurred-loss model: a bank provides mainly after a loan has defaulted. From 1 April 2027, RBI’s Expected Credit Loss (ECL) directions, issued on 27 April 2026, move banks to a forward-looking model with three stages.
- Stage 1: loans with no significant rise in credit risk. The bank provides for losses expected in the next 12 months.
- Stage 2: loans where credit risk has risen significantly. There is a rebuttable presumption of this when payments are more than 30 days past due. The bank provides for losses over the loan’s lifetime.
- Stage 3: credit-impaired loans, which are today’s NPAs. The 90-day rule stays.
RBI also sets minimum provisions. For corporate loans the floor is 0.40% in Stage 1 and 5% in Stage 2. For farm credit it is 0.25% and 5%, and for individual housing loans 0.25% and 1.50%. In Stage 3, the first-year floor is 25% for secured and 40% for unsecured corporate exposures.
Banks may add the one-time extra provision back to core capital in diminishing steps: four-fifths in 2027-28, then three-fifths, two-fifths and one-fifth, ending on 31 March 2031. ICRA estimates the impact on core capital ratios at under 150 basis points. For you, the new thing to watch is each bank’s Stage 2 book, a new early-warning number.
11. Key takeaways
- An NPA is generally a loan overdue for more than 90 days; borrower-wise classification pulls in all loans to that borrower.
- Provisions rise as a bad loan ages, and they reduce profit before tax rupee for rupee.
- Gross NPA ratio shows how much is bad, net NPA ratio how much is unprotected, and PCR how well covered the bank is.
- Always ask whether a falling ratio comes from fewer bad loans or from a bigger loan book.
- Check profit quality: recoveries and provision reversals can flatter a quarter.
Frequently asked questions
What is a good gross NPA ratio for a bank?
There is no single number. Compare a bank with its own history and with peers of similar size and loan mix. The direction, the PCR and the slippages matter more than one figure.
Is a lower NPA ratio always good news?
Not always. It can fall because loans grew faster, or because the bank wrote off loans. Check the roll-forward.
What is the difference between gross NPA and net NPA?
Gross NPA is all bad loans. Net NPA subtracts the provisions already held against them, so it shows the unprotected part.
Why is PCR above 90% when net NPA is not zero?
Many banks quote PCR including technically written-off accounts. Without them the figure is lower. Bank of India’s tangible coverage, for instance, is about 73% against a reported 94.45%.
Do provisions reduce a bank’s cash?
No. A provision is an accounting charge that reduces profit and reserves. Cash is lost only when the loan is actually not recovered.
What is a slippage?
A slippage is a standard loan that turns into an NPA during the period. The slippage ratio shows it as a share of loans.
Disclaimer: This article is for education only and is not investment advice. Figures are taken from public results and RBI directions as of the date above and may be revised. Please read the bank’s own filings before you decide.
Sources: RBI IRAC Directions, 2025 · RBI Resolution of Stressed Assets Directions, 2025 · RBI ECL Directions, 2026 · RBI capital adequacy directions · RBI PCA framework · Bank of India Q2 FY27 results, Free Press Journal · Bank of India Q2 FY27 walk-through, SimplifyingFin · Earnings-call summary, Cofacto · ICRA note on final ECL norms · Union Bank of India Q2 FY27, PSU Connect · Bank of Baroda Q2 FY27, Multibagg